Biologists are obsessed with records.
We like to learn about the smallest and biggest cells, the animals that live longest, and the birds which migrate furthest. Perhaps this is an intrinsic part of Human Nature; but a part of me — deep down — wants to resist it. I’ll not be a stamp collector, I think, or mere record keeper! No; I shall study the mundane and the average, such that I can understand life as it really is, or at least usually is, on this beautiful Earth.
And yet, what’s the fun in averages? I think there is something about “records,” and our hunt for them, that serves a valuable purpose. Indeed, records are often a starting point for a deeper curiosity.
When we learn of an organism that lives for hundreds of years, or first hear that elephants do not get cancer despite the abundance of cells in their bodies, it is only natural to think, “Wait, then why do humans get cancer? We have way fewer cells than elephants!” In this way, records become a starting point toward rich questions.
But the record I think about most is cell division; specifically, why an obscure microbe — called Vibrio natriegens — is able to divide every 9.8 minutes and not a moment sooner.
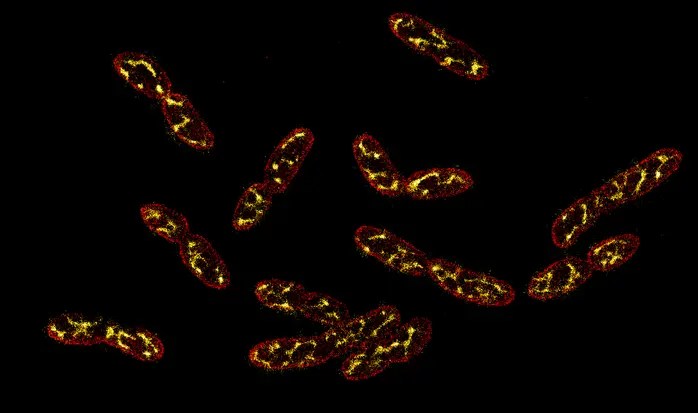
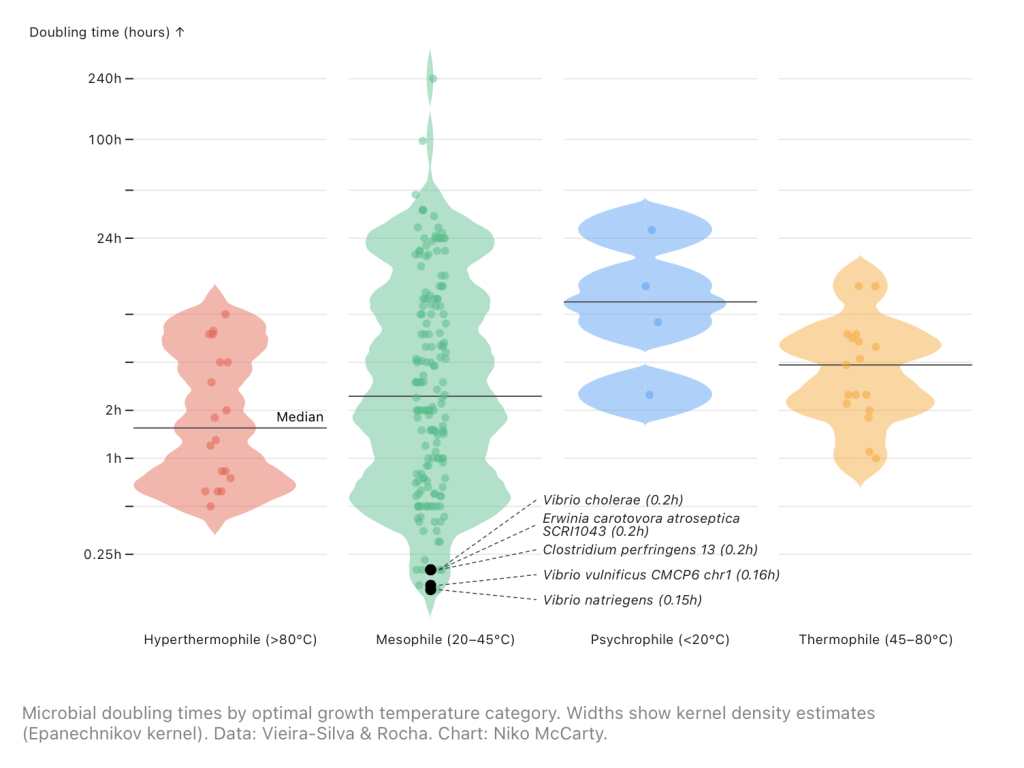
V. natriegens was first isolated by William Payne, a professor at the University of Georgia, from a glob of mud on Sapelo Island in 1958. Four years later, a man named R.G. Eagon incubated these cells at 37°C, shaking them vigorously in a liquid broth containing blended bits of brains and hearts. It was Eagon who found, in this experiment, that the cells divided every 9.8 minutes. This must have been a startling discovery, because the average microbe divides every three hours or so. Some microbes, living deep in the Earth’s crust, divide once every few years.
It has been more than 60 years since Eagon made his discovery, and yet nobody has found a microbe which grows faster than V. natriegens. Is 9.8 minutes some kind of magical threshold; a speed limit to life’s replication? I don’t think so. And the reason I say so is because of a single equation, the parameters of which may actually reveal how to make cells grow faster.
False Assumption
My first assumption was that a cell’s division time is limited by DNA replication. For one cell to become two, the cell must copy its genome and pass one copy to each offspring. The bigger the genome, the longer it takes to make a copy, and the slower a cell divides. Right?
Not quite. The enzyme responsible for copying the genome, called DNA polymerase, moves at roughly 1,000 bases per second. V. natriegens has about 5.17 million bases in its genome, split across two chromosomes. The first chromosome has 3.25 million bases, and the second has 1.93 million bases. At normal speed, one polymerase would need 54 minutes to copy the first chromosome and 32 minutes to copy the second.
For years, many researchers thought that splitting the genome across two chromosomes was what enables V. natriegens to grow fast. With two chromosomes (so their thinking went), two polymerases can copy the genome in parallel, thus cutting division times in half! But then a 2024 paper came out, explaining how researchers had fused both chromosomes into a single genome, and the cells still divided every nine minutes. So clearly that’s not the bottleneck here.
The truth is that cells don’t use a single DNA polymerase to copy their genomes. Instead, two polymerases copy the genome at the same time, albeit in opposite directions. This bidirectional copying also happens many times simultaneously. As soon as one set of DNA polymerases begin copying the chromosome, another set latches on and starts copying it, too. Multiple copies of the genome are thus in the act of being made at any given moment. When one cell becomes two, each “daughter” not only inherits a genome, but also inherits the copies of that genome that are in the act of being made.
DNA replication is not the bottleneck to cell division. In theory, a cell could initiate dozens of rounds of DNA replication all at once, provided it has enough energy and nucleotides to do so.
The true bottleneck, it turns out, are actually the ribosomes, or big “machines” (a tired metaphor, I know) that build proteins. Before a cell can split in two, it must double its pool of ribosomes so that each daughter cell has enough to survive. And as we’ll see, this is really slow.
Many students are taught to think of ribosomes as “proteins that build other proteins.” But two-thirds of a ribosome’s mass is RNA; not amino acids. Each ribosome is also built from two pieces, called the large and small subunits. These two pieces glom onto a strand of messenger RNA and “read” its code to build proteins. After a ribosome has finished making a protein, it falls off the messenger RNA, searches for a new strand, and begins building the next one.
E. coli and V. natriegens have nearly identical ribosomes. In both, the small subunit contains a long strand of RNA, called ribosomal RNA, packed inside of 21 proteins. The large subunit has two strands of RNA (one short and another long) stuffed inside of 33 proteins. Of all the RNA molecules floating around a cell, about 80 percent are ribosomal. (Messenger RNAs account for only a tiny fraction.) In total, each ribosome contains 4,566 nucleotides of RNA and 54 separate proteins, totaling 7,500 amino acids. This is enormous; an average protein has about 300 amino acids. Once built, each ribosome can “stitch together” about 16 amino acids per second.
Now, I know there are a lot of numbers here. But recall that V. natriegens divides every 9.8 minutes, and consider what happens when we crunch the numbers on how long it takes a ribosome to build a copy of itself:
There are 7,500 amino acids in a ribosome, and each ribosome stitches 16 amino acids together each second. Therefore, it takes one ribosome about 7 minutes and 50 seconds to build another ribosome; and V. natriegens divides every 9.8 minutes! That gap of about two minutes is all the time the cell has to make everything else: copying DNA, growing its lipid membrane, and building all the other proteins it needs to survive. Ribosome biosynthesis is the true bottleneck on cell division. No organism can divide faster than the time it takes to make its own ribosomes.
If this explanation strikes you as too tidy, though, you are certainly not alone. I had the same reaction at first. And one question I began thinking about is this: Sure, it takes one ribosome about eight minutes to make one ribosome. But each cell has tens of thousands of ribosomes. Those ribosomes all work together, in parallel, to make more ribosomes. Because the 7,500 amino acids required to build each ribosome are split across 54 different proteins, 54 ribosomes could (in theory) work together to build each new ribosome.
But this is only true at the level of one ribosome. If we zoom out to the whole cell, the math doesn’t work out quite this cleanly. For a cell to go from R ribosomes to 2R, it must build R ribosomes, and it only has R ribosomes to do this. Each ribosome, on average, must make one other ribosome; and that takes about eight minutes.
(Parallelization works when you can add more “machines” independent of output but, in this case, the “machines” are also the output.)
| Category | Metric | Value |
| DNA Polymerase | Speed | ~1,000 bases/second |
| V. natriegens Genome | Total size | 5.17 million bases |
| Number of chromosomes | 2 | |
| Chromosome 1 | 3.25 million bases | |
| Chromosome 2 | 1.93 million bases | |
| Replication Time (single polymerase) | Chromosome 1 | 54 minutes |
| Chromosome 2 | 32 minutes | |
| Cell Division | V. natriegens division time | 9.8 minutes |
| Ribosome Composition | Total ribosomal RNA | 4,566 nucleotides |
| Total proteins | 54 | |
| Total amino acids | 7,500 | |
| Ribosome Speed | Translation rate | ~16 amino acids/second |
| Time for one ribosome to build one ribosome | 7min 50sec |
This raises other questions, too; like rather than fully double its ribosome pool, why doesn’t a dividing cell give fewer ribosomes to each daughter?
A cell could do this. But doing so would mean each daughter cell then needs to “catch up” and make more ribosomes so it can grow at its maximum capacity again. Cells must devote about half **their ribosomes toward making the various proteins needed to sustain life (not ribosomes). If a cell devotes too many ribosomes toward making other ribosomes, it will not be able to sustain its metabolism, or make energy, or copy its genome, or all that other stuff. Short-shifting daughter cells, then, is just passing a problem down to future generations.
So the ribosome bottleneck holds, no matter how we come at it. But this makes V. natriegens’ growth rate even more impressive. This microbe, pulled from a glob of mud in Georgia, has evolved a way to divide quite close to its theoretical, biophysical limit; mostly by optimizing for ribosome biosynthesis.
First, V. natriegens has at least a dozen ribosomal RNA operons, or gene clusters encoding ribosomal RNA molecules, in its genome. E. coli, for comparison, has seven. And second, these ribosome genes are located next to “strong” promoters, or genetic sequences that recruit RNA polymerase enzymes. In other words, Vibrio devotes more of its genome to ribosomal genes, and has also evolved a stronger “start” signal for those genes, meaning the cell makes ribosomal RNA much more frequently, and in higher numbers, than other microbes.
Scientists don’t fully understand why V. natriegens evolved to grow quickly, though. But remember that these cells were first discovered in nutrient-rich mud, on an obscure island off the coast of Georgia, where lots of organic matter washes up with the tide. As this tide flushes out, nutrients go with it. In their natural environment, then, these cells are exposed to ebbs and flows of nutrient-rich soup; cells that divide faster are able to “scoop up” more nutrients before it disappears. The end result, over millions of years, is that cells evolve to grow and consume as quickly as possible.
I can’t help but wonder why evolution “stopped” at 9.8 minutes, though, rather than the eight minutes it takes to theoretically double the ribosome pool. Those extra two minutes, it turns out, come from the fact that a dividing cell must make not only ribosomes, but also many other proteins, before it divides. A cell needs to make all the enzymes required for DNA replication, proteins to “pull apart” the chromosomes for each daughter cell, lipid molecules to grow the cell membrane, and so on. All of these things require proteins, which are made by ribosomes. And that’s why ribosomes can’t spend all their time making other ribosomes! (Even at maximum growth rates, most microbes only devote about one-third of their ribosomes toward making more ribosomes. The rest are used to build other things.)
Still, I wonder if cells could grow even faster.
Math “Knobs”
The interesting thing about essays is that they describe phenomena in the English language, and thus are imprecise by their nature. I can work really hard to edit my sentences and make my words as clear as possible, but there will always be a chance that you, my reader, will be confused. Or, I could just simplify everything by giving a single equation which captures and explains the whole phenomenon. It turns out that this works remarkably well for cell division.
A few years ago, researchers at Caltech published a paper, titled “Fundamental limits on the rate of bacterial growth and their influence on proteomic composition.” In it, they write down two simple, mathematical relationships. First, they note that the fraction of a cell’s mass devoted to ribosomes depends on how many ribosomes it has (of course) and how big those ribosomes are, relative to all the proteins in the cell. And second, for a cell to double in size, it must synthesize a cell’s worth of new protein, and the rate at which ribosomes do this determines how fast the cell grows.
By smashing these two relationships together, they arrived at a single equation — with just four parameters1 — that describes how quickly a cell will divide:
The left side, λ, is the cell’s growth rate, or number of times it divides per hour. On the right, there are four terms. rt is the translation elongation rate, or the speed at which a ribosome puts amino acids together; in most microbes, this is 15-30 amino acids per second. fa is the fraction of ribosomes actively making proteins at any given moment. In a normal cell, at a narrow slice of time, about 15 percent of all ribosomes are idle. ΦR is the ribosomal mass fraction, or percentage of all proteins in the cell that are ribosomes. And LR, on the bottom, is the total number of amino acids in each ribosome.
The beauty of this equation — the reason it nearly brings a tear to my eye — is because it immediately explains both the biophysical limits of cell division and the knobs, or “dials,” by which we can change it. We can intuit, for example, that f_a must always be less than 1.0, because some ribosomes will always be between jobs, searching for their next strand of messenger RNA. And ΦR must be less than 1.0, too, because a cell made entirely of ribosomes is a cell without a metabolism, membrane, and so on. Both of these parameters have hard ceilings.
To get a feel for what’s biologically plausible, let’s plug in some back-of-the-envelope numbers for V. natriegens:
rt = 20 amino acids per second
fa = 0.85 active ribosomes
ΦR = 0.50 of protein mass is ribosomes
LR = 7,500 amino acids per ribosome
Crunching these numbers, we get λ = 4.08 h⁻¹, or a doubling time of 10.2 minutes; remarkably close to what Eagon measured in 1962!2
The nice thing about mathematical equations, like this, is that they not only point at biophysical limits, but also reveal which parameters can be tweaked to change the results. Now that we know the four parameters which set growth rate, in other words, we can begin to dream up clever ways to tune each “knob” to make cells grow faster or slower.
One option is to engineer ribosomes such that they literally build proteins faster. If we could raise the rt parameter to 30 or more (as some other microbes have), then division time goes down. Or, alternatively, we could try and make ribosomes smaller. Researchers have already explored this for E. coli. In 2002, researchers studied which proteins — of the 54 found in the E. coli ribosome — were “conserved” across other bacteria, archaea, and eukaryotes. In other words, they wanted to figure out which proteins show up again and again across species, and which proteins were only found in a few species (and, thus, might be disposable.)
They found that about 21 of E. coli‘s ribosomal proteins show up in bacteria, but not archaea or eukaryotes, and some could plausibly be trimmed. I’m not aware of anyone who has actually tried this, but I wouldn’t be surprised if we could cut out, say, 20 percent of the ribosome without impacting its function too much, and thus shave a couple minutes from the theoretical cell division time. Somebody should try this!
Another option is to raise fa by boosting the fraction of “active” ribosomes within the cell. Protein synthesis is the most energetically expensive thing a cell does, so many organisms have evolved mechanisms to shut ribosomes down when they are not needed, thus conserving energy. E. coli, for example, carry “hibernation factors,” proteins that grab onto ribosomes and push them into an inactive form when they are not needed. It’s not known if V. natriegens encode the same proteins, but we could search through their genome and delete similar genes to test this theory.
Or, perhaps, we could take a more agnostic approach and just let evolution take its course, albeit in an accelerated way. If Vibrio evolved with slow ocean tides, maybe we could make them evolve even faster in the laboratory. Perhaps we could run a Richard Lenski-esque experiment, in which V. natriegens’ cells are grown in a robotic bioreactor and flooded with glucose every few hours, followed by stretches of nutrient starvation. If we repeat this lots of times, some microbes may evolve to grow even faster during those periods of high glucose. Or maybe not; V. natriegens may already be quite close to the theoretical cell division time limit.
These experiments haven’t been done yet. But that, in a way, is the whole point.
I never planned to write this essay, which emerged entirely by accident, with one question leading to another, until I found myself deep in the weeds of ribosomes and biophysics and growth rates. What surprised me most, in the end, was that the clearest answer to my question was found not in words, but rather in a single equation with just four parameters. Biology, at its limits, can often be described best with mathematics.
This equation only exists because generations of biophysicists heard about a record set by a microbe pulled from Georgia mud in 1958 and couldn’t let it go. They spent decades modeling ribosome fractions and translation rates; not because anyone asked them to, but because the record raised questions which bothered them and they wanted desperately to answer. Eventually, they wrote down an equation that not only explains why V. natriegens divides as fast as it does, but points toward how we might push it further still.
Records, it turns out, are not merely trivia, but rather a map toward the loose threads that, when pulled, unravel something remarkable about the world. In glorifying the exceptional, we can find answers to the mundane.
- A typical E. coli has 75,000 ribosomes and V. natriegens has 115,000 ribosomes. But why? The equation also helps explain why this is. The gist is that cells can’t just crank up ribosome speed indefinitely, because there is a maximum rate of protein biosynthesis. The only way to grow faster, then, is to make more ribosomes. But the downside of this is that, by making too many ribosomes (especially when nutrients are scarce), the cell’s amino acids will get depleted and the cell will slow down. Therefore, cells must carefully balance their ribosome numbers to match their available nutrients. This also explains, somewhat, why larger cells — even of the same species — divide more quickly; they are using the extra space to house more ribosomes. ↩︎
- Cells grow exponentially; each division yields two cells, each of which divides again. Therefore, the actual doubling time is not 60/λ, or roughly 15 minutes, but rather ln(2)/λ, or about 0.693/λ. Hence the 10.2 minute figure. ↩︎
